15 Years of NASDAQ

Time marches on and we can now say the darling index of the 90's, the NASDAQ, has recovered from its high of 5000 back in the year 2000.Although there's isn't much investment benefit in looking in the rearview mirror, the stats geek in me likes to do so anyway. That said, let's look at the NASDAQ a little closer. What drove the recovery? Have the original internet stocks recovered in value? Not exactly.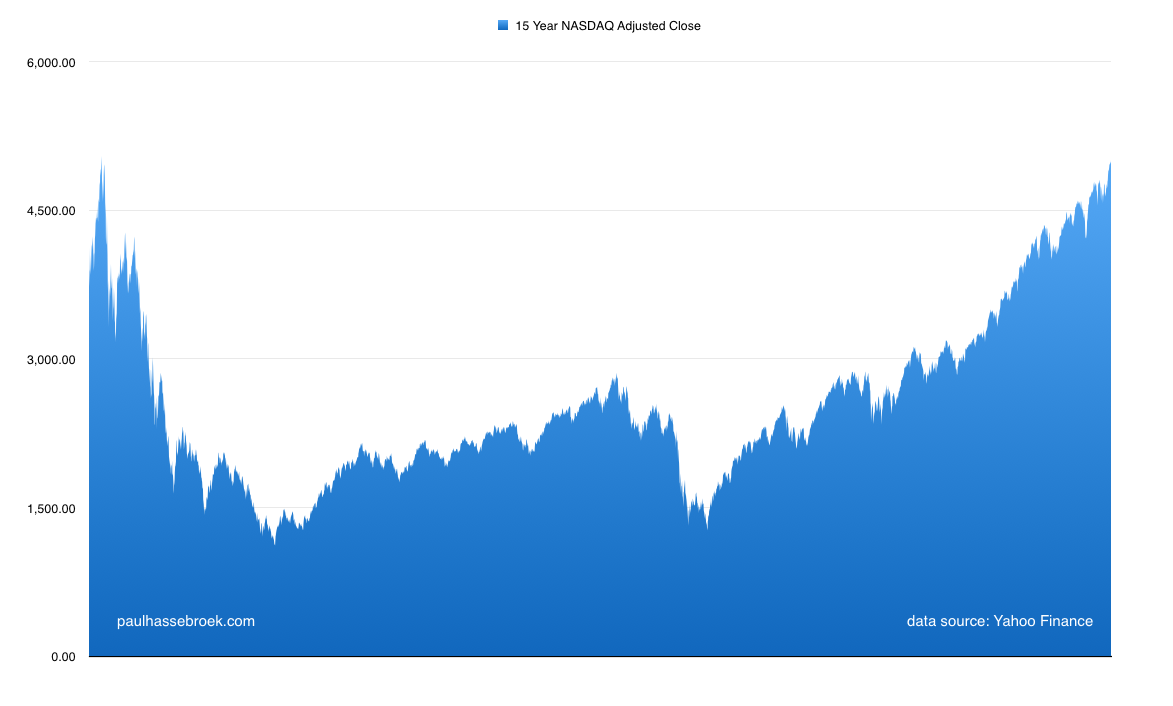 In the 90's, the NASDAQ was home to young, fast growing technology companies. Many traded a very large earnings multiples. So how does today's NASDAQ compare?First off, the components aren't the same. Some companies don't exist and others were acquired. The companies remaining the index are more mature. The average age of a company in the NASDAQ in 1999 was 15.1 years. Today the average age is 25.0 Years.Multiples are lower too. In 1999, the average P/E of the index was 152; at the end of 2013, it was 31.For fun, here are the ten largest components then and now:
| 12/31/99 NASDAQ Component | Mkt Cap ($BLNS) | 12/31/13 NASDAQ Component | Mkt Cap ($BLNS) |
|---|---|---|---|
| Microsoft | $606 | Apple | $505 |
| Cisco | $360 | Microsoft | $312 |
| Qualcomm | $332 | $310 | |
| Intel | $277 | Amazon | $182 |
| Worldcom | $228 | Intel | $129 |
| Oracle | $151 | Qualcomm | $125 |
| Dell | $132 | Cisco | $120 |
| Sun Microsystems | $117 | Gilead Sciences | $155 |
| Yahoo | $103 | Comcast | $111 |
| JDS Uniphase | $75 | $102 |
I'm really interested in this data. I don't think there is necessarily an investment lesson here other than to say that paying attention to valuation of companies may have saved some drama (trauma?) for investors. In the end, the NASDAQ looks like it does today because the highest quality companies are the ones that continue to grow.